Our three approaches
Our ready-made funds are designed for growth, with the risk turned up or down according to taste.

Your investment options
Which one’s right for you depends on the ups and downs you’re happy with, and the longer you invest, the greater potential your money has to grow.
Investment mix explainedThe investment Mix shows you how much of your money typically goes into the higher risk investments with higher potential returns, and how much goes into the lower risk investments with lower potential returns.
Depending on how the market's performing, our experts might flex the mix. But they always aim for a balance of risk and rewards in line with your chosen approach.
Read our guide to investing money and the risksCautious
A lower-risk way to invest long term. Fewer ups and downs, lower potential returns, fewer sleepless nights.
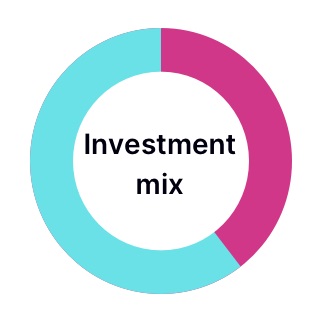
- 40%
Typically high risk
- 60%
Typically low risk
Balanced
The potential to grow your money with a few more ups and downs along the way. The Goldilocks choice.
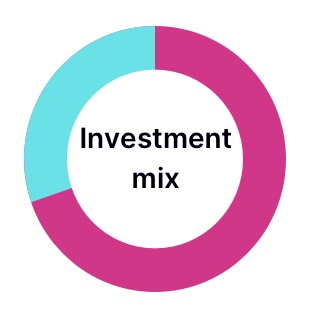
- 70%
Typically high risk
- 30%
Typically low risk
Adventurous
Investment confident? This one's got more ups and downs for higher potential returns. Go big or go home.
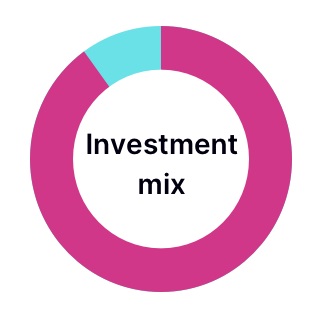
- 90%
Typically high risk
- 10%
Typically low risk
These funds have some sustainability characteristics due to being responsibly invested. Sustainable investment labels help UK investors find funds that have a specific sustainability goal. These funds don't have a UK sustainable investment label because they don't have a specific sustainability goal.
The ups and downs
Investing's for the long term - usually at least 5 years.
The lines on this graph show a 5-year return on £1,000 invested in our 3 growth approaches.
When it comes to investing, the past isn't a reliable guide to the future, and there's always the risk you might get back less than you put in.
Source data: Lipper, 30 June 2020 to 30 June 2025, bid to bid with net income reinvested.
In the chart, we show performance over the last 5 years for each of our growth approaches, so you can see how they differ in terms of ups and downs. The Adventurous approach has bigger rises and falls than Balanced, and Balanced more than Cautious. This shows there is the potential for higher returns, but as the falls in value of the three growth approaches show, depending on markets and when you withdraw, there is the possibility of getting back less than you invested. Each of our funds have a stock-market related performance comparator. Returns over each of the last five years against each fund’s comparators are shown in the past performance table(s) below. The chart uses simulated performance for periods where the funds either were not in market or followed a different investment strategy. So, to help fund comparison, we've replicated the performance of the markets the funds invest in, to indicate what the performance may have been before its launch or change in strategy. The simulated return takes into account total annual charges of 0.45% and that the mix of assets are rebalanced once per month, but does not include the separate account fee of 0.30%.

Take a look at the past performance
The table below shows the annualised returns of this approach in each of the past 5 years. Remember, past performance isn’t a reliable guide to future performance.
Here's the detail at 30 June 2025.
| June 2020 to June 2021 | June 2021 to June 2022 | June 2022 to June 2023 | June 2023 to June 2024 | June 2024 to June 2025 | |
|---|---|---|---|---|---|
| Cautious | 7.3% | -8.1% | 2.0% | 7.6% | 5.4% |
| Performance Comparator* | 6.8% | -7.7% | 2.8% | 8.4% | 6.5% |
Cautious changed strategy in October 2021. To help you compare it with other funds we have replicated the performance of the markets the fund invests in, to indicate what the performance may have been prior to the strategy change. The simulated return takes into account the current annual charge of 0.45% and that the mix of assets are rebalanced once per month, but does not include the separate account fee of 0.30% per year.
Cautious doesn’t use a benchmark as a guide for investing or as a target to beat. But we do use a performance comparator which investors may want to compare the fund’s performance against. This comprises 30% shares and 70% bonds. Shares are represented by the MSCI All Countries World Index GBP, whilst bonds are represented by the Bloomberg Global Aggregate Bond Index – GBP Hedged. The fund invests differently to the performance comparator therefore returns will always be different. For example there are differences in the way the fund is built vs. the comparator, along with the cost of investing, which is included for the fund return, but not the comparator. You cannot invest in the performance comparator.
Take a look at the past performance
The table below shows the annualised returns of this approach in each of the past 5 years. Remember, past performance isn’t a reliable guide to future performance.
Here's the detail at 30 June 2025.
| June 2020 to June 2021 | June 2021 to June 2022 | June 2022 to June 2023 | June 2023 to June 2024 | June 2024 to June 2025 | |
|---|---|---|---|---|---|
| Balanced | 13.8% | -6.8% | 5.9% | 11.2% | 6.0% |
| Performance Comparator* | 14.2% | -6.1% | 6.4% | 13.3% | 6.8% |
Balanced changed strategy in October 2021. To help you compare it with other funds we have replicated the performance of the markets the fund invests in, to indicate what the performance may have been prior to the strategy change. The simulated return takes into account the current annual charge of 0.45% and that the mix of assets are rebalanced once per month, but does not include the separate account fee of 0.30% per year.
Balanced doesn’t use a benchmark as a guide for investing or as a target to beat. But we do use a performance comparator which investors may want to compare the fund’s performance against. This comprises 60% shares and 40% bonds. Shares are represented by the MSCI All Countries World Index GBP, whilst bonds are represented by the Bloomberg Global Aggregate Bond Index – GBP Hedged. The fund invests differently to the performance comparator therefore returns will always be different. For example there are differences in the way the fund is built vs. the comparator, along with the cost of investing, which is included for the fund return, but not the comparator. You cannot invest in the performance comparator.
Take a look at the past performance
The table below shows the annualised returns of this approach in each of the past 5 years. Remember, past performance isn’t a reliable guide to future performance.
Here's the detail at 30 June 2025.
| June 2020 to June 2021 | June 2021 to June 2022 | June 2022 to June 2023 | June 2023 to June 2024 | June 2024 to June 2025 | |
|---|---|---|---|---|---|
| Adventurous | 21.3% | -6.4% | 8.2% | 14.7% | 6.2% |
| Performance Comparator* | 19.3% | -5.1% | 8.8% | 16.6% | 7.0% |
Adventurous launched in November 2020. To help you compare it with other funds we have replicated the performance of the markets the fund invests in, to indicate what the performance may have been prior to its launch. The simulated return takes into account total annual charges of 0.45% and that the mix of assets are rebalanced once per month, but does not include the separate account fee of 0.30% per year.
Adventurous doesn’t use a benchmark as a guide for investing or as a target to beat. But we do use a performance comparator which investors may want to compare the fund’s performance against. This comprises 80% shares and 20% bonds. Shares are represented by the MSCI All Countries World Index GBP, whilst bonds are represented by the Bloomberg Global Aggregate Bond Index – GBP Hedged. The fund invests differently to the performance comparator therefore returns will always be different. For example there are differences in the way the fund is built vs. the comparator, along with the cost of investing, which is included for the fund return, but not the comparator. You cannot invest in the performance comparator.
Remember, the value of investments can go up and down, so you may get back less money than you put in. Tax depends on your individual circumstances and the regulations may change in the future.
How your money's invested
Whichever investment choice is right for you, our overall approach is the same. Here's how our experts look to grow your money:
Investing in a fund of funds - your money's pooled together with other Virgin Money customers and invested in a fund made of other funds. Everyone's money is spread around, so everyone's risk is reduced.
Mixing it up - changing the fund's mix of shares, bonds and other investments changes how much your money goes up and down over time, and helps us keep the overall risk level at an acceptable level.
Going global - investing worldwide spreads the risk and opens up more opportunities to grow your money.
See how we invest in various companies, industries and regions for maximum growth with minimal harm.
See how we invest your money
Our charges
Our charges are 0.75% in total each year, based on the value of your account. This is made up of two clear and simple charges.
- An Account Charge of 0.30% for managing your account
- A Management Charge of 0.45% to manage your investments

More about our assumptions
Close ModalWhat you’ll pay in
We assume you’ll keep making the same regular payments throughout the time you’re investing with us.
ISA allowance and tax
We assume the annual ISA allowanceThe ISA allowance is the maximum amount you’re allowed to put into an ISA, during a tax year. In this current tax year, you can invest up to £20,000. will stay the same. So, we cap your annual payments at that level even if you tell us you want to pay more. We also assume there’ll be no tax implications for taking your money out.
Imagining the future
We consider past performance when estimating possible outcomes for your investment based on how much you invest, for how long and how the market might perform. However, past performance isn’t a reliable guide to future performance – investments can go up or down.
To work out this estimate we do lots of calculations behind the scenes. To keep it reasonable, we ignore both the highest and lowest 5% of results when we show you the estimated value rangeWhat your investment could be worth. and the low and high selected market scenarioHow stock markets perform generally..
Cash returns
To estimate the equivalent potential cash returns we based our forecast returns from a cash (or near cash) investment fund. This simulates the effects of holding cash as an asset, instead of holding cash with a bank.
Considering inflation
We show what your investment might be worth in today's money, after allowing for inflation. We consider lots of possibilities for inflation, rather than a single fixed % because the rate of inflation can rise and fall over time. Inflation reduces the value of what you can buy in the future as well as the value of your savings.
We remove our two charges (Account Charge and Annual Management Charge) from the returns as we calculate your estimate, assuming they’ll stay the same throughout the time you’re investing with us.
Finally, we round our estimates down a bit, just to make the numbers a bit easier to read - remember they’re only a guide and the estimated returns aren’t guaranteed. But we hope they help.
So that’s how we work out your estimate.
Remember, these are only indications. What you get back will depend on how the funds perform, if you make changes to the length of time you’re investing, and if you change the amount you put in.